|
|
|
|
|
Name
Cash Bids
Market Data
News
Ag Commentary
Weather
Resources
|
Chart of the Day - October Lean Hogs
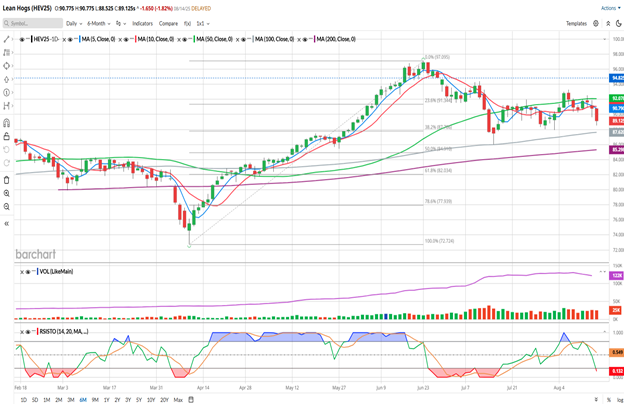
The information and opinions expressed below are based on my analysis of price behavior and chart activity Thursday, August 14, 2025 If you like this article and would like to receive more information on the commodity markets from Walsh Trading, please use the link to join our email list -Click here Every morning, at about 8 AM CST, I post a short video highlighting where I see opportunities in the futures markets. You can view my most recent video here October Lean Hogs (Daily)
Today, October Lean Hogs closed at 89.125, down 1.650, or 1.82% on the day. If you look at the chart above, you may notice that since prices broke below the 50-day moving average (green, 92.078) on July 14th, they’ve been content, for the most part, to stay under that average. The break that triggered that move lower lasted about 3 weeks, stopping near the 100-day moving average (grey, 87.620 today)on July 15th. For the past month, prices have been consolidating, or going sideways. Today’s close marks the lowest close since July 29th. You may see that the 5- and 10-day moving averages (blue,red) made a bearish crossover with today’s activity, which may turn out to be a valid sell signal. That indicator has been a bit whipsaw-ish, for the past month, as the trend has been choppy. Today, those averages are at 90.790 and 91.060, respectively. The long-term averages on this chart, the 100- and 200-day (grey, purple) are below the market at 87.620 and 85.298, offering potential support. There’s a still a gap on the chart up near 94.825 (blue dotted) from June 26-27, but that doesn’t appear to be currently in play, in my opinion. The Fibonacci retracement (grey) drawn from the April low to the June high, suggest resistance near the 23% level at 91.35. The 38% is the next level of potential support, near 87.78, while the 50% mark is near 84.910. That seems like a reasonable target, should the market test the spike low of 86.025 from July 15th. The RSI/Stochastic indicator (bottom sub-graph) is just barely getting into oversold status today and is currently pointing lower. Aggressive and well-margined traders may do well to consider short futures positions, perhaps near the low from yesterday, which was 89.625. I think your risk/reversal might be just above the 10-day average, perhaps near 91.300. That would work out to a potential loss of $670, before your commissions/fees. A profit target near the July low of 86.025 would result in a possible gain of 3.600, or $1,440, before commissions/fees. You may choose to hold out for a test of the 200-day near 85.300. That level would result in a potential gain of $1,730, again before commissions/fees. Less aggressive traders may do well to consider buying the October 84.000 Puts. Those settled at 1.125 today, or $450 before your commissions and fees. Should you go that route, I would suggest placing a GTC order to take profit at 3x what you paid for the option. If you like what you’ve read here and would like to see more like this from Walsh Trading, please Click here and sign up for our daily futures market email. Every morning, at about 8 AM CST, I post a short video highlighting where I see opportunities in the futures markets. You can view my most recent video here October Lean Hogs (Weekly)
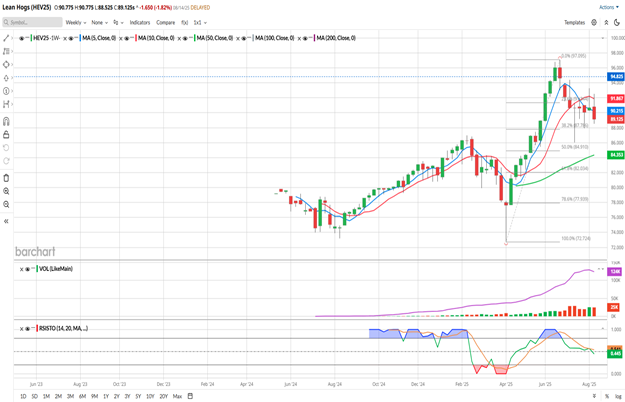
So far this week, October Lean Hogs are down 1.550, settling at 89.125 today. Looking at the chart above, you might notice that prices rallied earlier in the week, testing up through the 10-week moving average. As of Thursday’s trade, prices are back below the 5-week moving average and seeming weak. Those levels are now resistance, in my estimation, near 91.87 (red, 10-week) and 90.21 (blue, 5 week). A closer look to those averages indicates a bearish crossover 3 bars (weeks) ago. Prices are still trading within the range of the large, skinny bar that occurred in the middle of July. We’ve seen prices trade a little higher than that week’s high of 91.250 three times since then, but the market has been unable to hold that level and price has come back into that range on weekly closes. The lower end of that week’s range was 86.025. That may be a reasonable target from here. There may be additional weekly support levels near the February high of 86.975, the 50% Fibonacci retracement (grey) near 84.910 or perhaps the 50-week average (green) near 84.35 The RSI/Stochastic indicator (lower sub-graph) is roughly mid-range and trending, or pointing, lower. According to Barchart’s seasonal data prices tend to go higher in August, September and October, especially of the past 5 years. The longer-term look, over the past 15 and 30 years, suggests more aggressive weakness ahead, but fundamental supply/demand has changed in most markets since 2020 and covid. To my eye, Hogs haven’t been exactly holding true to their seasonal patterns for while now. If you like what you’ve read here and would like to see more like this from Walsh Trading, please Click here and sign up for our daily futures market email. Every morning, at about 8 AM CST, I post a short video highlighting where I see opportunities in the futures markets. You can view my most recent video here Jefferson Fosse Walsh Trading Direct 312 957 8248 Toll Free 800 556 9411 jfosse@walshtrading.com www.walshtrading.com Walsh Trading, Inc. is registered as a Guaranteed Introducing Broker with the Commodity Futures Trading Commission and an NFA Member. Futures and options trading involves substantial risk and is not suitable for all investors. Therefore, individuals should carefully consider their financial condition in deciding whether to trade. Option traders should be aware that the exercise of a long option will result in a futures position. The valuation of futures and options may fluctuate, and as a result, clients may lose more than their original investment. The information contained on this site is the opinion of the writer or was obtained from sources cited within the commentary. The impact on market prices due to seasonal or market cycles and current news events may already be reflected in market prices. PAST PERFORMANCE IS NOT NECESSARILY INDICATIVE OF FUTURE RESULTS. All information, communications, publications, and reports, including this specific material, used and distributed by Walsh Trading, Inc. (“WTI”) shall be construed as a solicitation for entering into a derivatives transaction. WTI does not distribute research reports, employ research analysts, or maintain a research department as defined in CFTC Regulation 1.71. This article contains syndicated content. We have not reviewed, approved, or endorsed the content, and may receive compensation for placement of the content on this site. For more information please view the Barchart Disclosure Policy here.
|
|
|